Bridging the Data Gap: A Semantic Translation Layer for UK Poverty Data
Ponderings on how to bridge the data gap. Exploring questions, semantic layers, TRE's and feedback loops.
Last week I attended a workshop with RSS and JRF looking at Data Gaps in understanding poverty. I had a half (or quarter) baked concept, but I was so overly tired that I couldn't really form a well thought out way of explaining it. So I went down the rabbit hole after a bit of sleep.
We talk a lot about data gaps in the UK, the idea that we don't have enough data to understand the issues we care about. But I think often, the problem isn't that the data doesn't exist, it's more often the case that the people who need it don't know it exists, can't find it, or can't tell whether it answers their question. Like many things, the gap isn't in the data, it's in the connection between data and need.
This is particularly acute for administrative data, the data collected by government departments as a byproduct of delivering services. Benefits claims, tax records, school meal eligibility, homelessness applications, GP registrations. This data is extraordinarily rich, but as I said, it’s primary use isn’t research, or understanding, it’s for delivery services. And that means the way it is described and structured is for that purpose. It's also, for the most part, extraordinarily hard to discover and understand if you're not already embedded in the system that produced it.
But government departments aren’t the only ones delivering services in this area. Local government and the VCSE are heavily involved in both delivery and trying to understand if our approaches are working

The three layers of disconnect
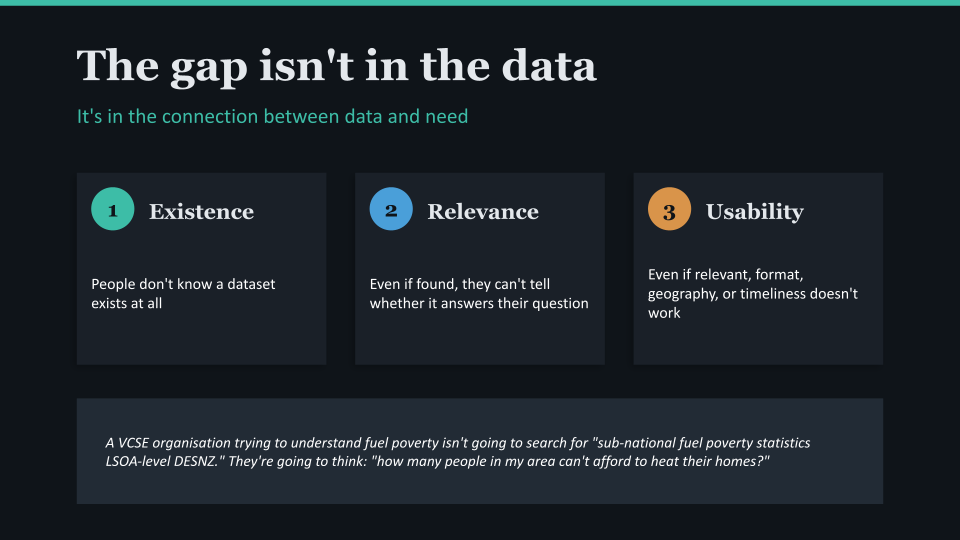
When a VCSE organisation is trying to evidence fuel poverty for a funding bid, they're not going to search for "sub-national fuel poverty statistics LSOA-level DESNZ (department for energy security and net zero for those following along at home)." They're going to think: "how many people in my area can't afford to heat their homes?" And they're going to hit a wall, not because the data doesn't exist, but because nothing bridges their question to the answer.
The disconnect operates at three levels.
- First, existence: people don't know a dataset is out there at all.
- Second, relevance: even if they find something, they can't tell whether it answers their specific question.
- Third, usability: even if it's relevant, the format, geography, or timeliness doesn't work for them.
Current data portals and catalogues - data.gov.uk, Stat-Xplore, Fingertips, the ONS website mostly address only the first level, and they do it using keyword search against technical metadata. The metadata describes the data in the language of the producer, not the language of the user.
What a bridge would look like
The idea is simple in concept: build a semantic translation layer that sits between user intent and data metadata. Instead of requiring users to learn the language of the data, the system learns the language of users' needs.
"Oh, you're trying to understand child poverty in your area? You'd want DWP's children in low-income families data for the baseline, DfE's free school meals data gives you a school-level proxy, and you could triangulate with HMRC's child benefit data, but be aware that FSM eligibility criteria changed with Universal Credit, so the time series has a break."
That response does three things:
- it translates from the user's framing to relevant datasets,
- it suggests combinations across departmental boundaries,
- and it carries contextual caveats about data quality.
These are the functions the bridge needs to perform.
How it could work technically
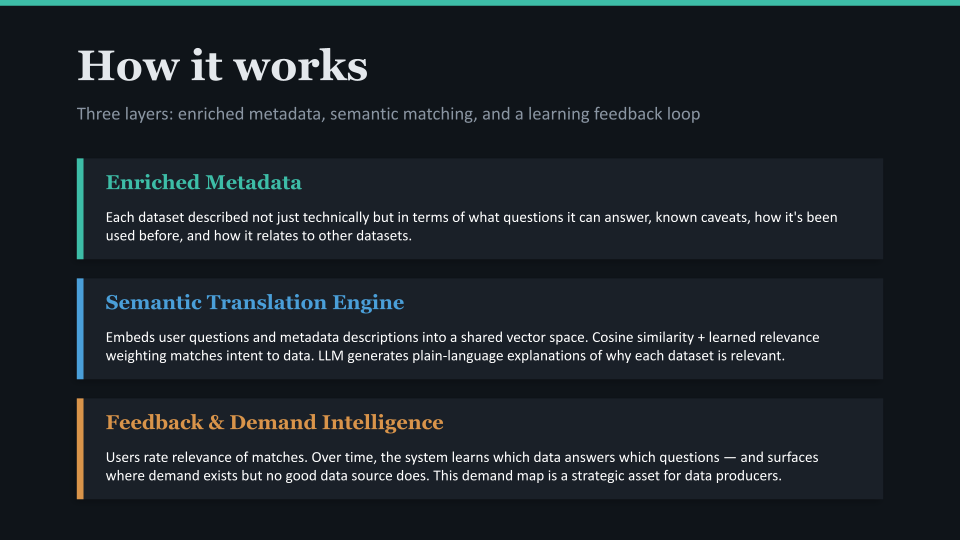
The core technical approach uses embeddings, vector representations that capture semantic meaning, to match user questions to enriched dataset descriptions. Two things get embedded into the same vector space:
User intents - the questions* people are trying to answer, expressed in their own language. "I want to understand health inequalities in Gateshead." "I need to evidence demand for youth services." "I'm writing a bid about digital exclusion among older people."
Enriched metadata - not just the raw catalogue entry, but descriptions of what each dataset can tell you, what questions it's been used to answer before, what it measures and what it misses, and how it relates to other datasets.
*stop me if you’ve heard me say this before…
When a user poses a question, the system embeds it, finds the nearest metadata vectors, and uses an LLM to generate a plain-language explanation of why each dataset might be relevant including caveats and suggestions for complementary sources.
The crucial addition is a feedback loop. Every time a user says "yes, that dataset was useful" or "no, that wasn't what I needed," the system learns. Over time, it builds a rich understanding of which data helps answer which kinds of questions, knowledge that currently exists only in the heads of a few specialist analysts.
Now this use of questions is something I've talked a lot about, and previously we at Data For Action explored the idea of a Question Bank which attempted to surface the most important questions people were trying to answer with data. And we built a prototype which did some of this semantic meaning, grouping similar questions automatically. Where I think this idea builds upon that is by focusing on the link between questions and metadata and perhaps proposing an enhanced semantic metadata standard.
Starting with poverty data
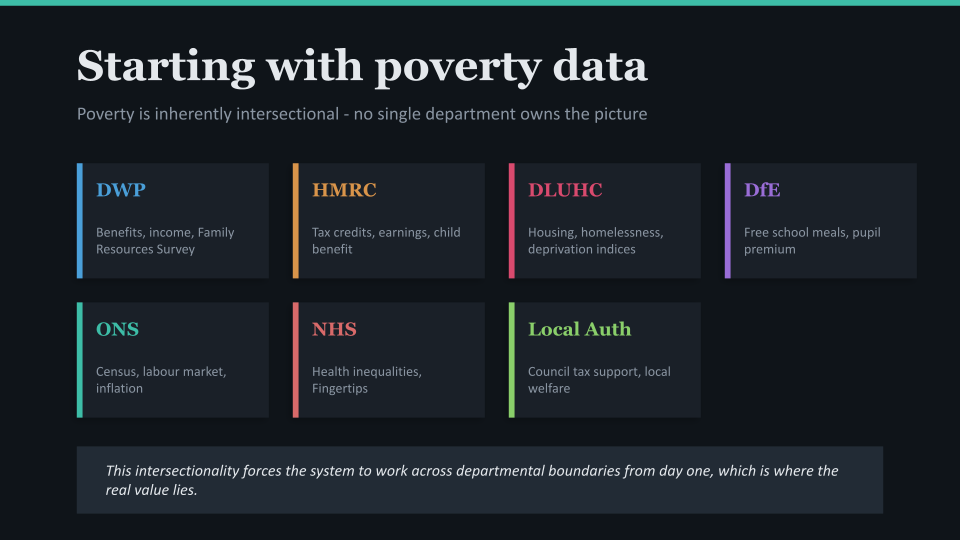
So I recognise this would require a fair bit of work across every government dataset. But as the workshop, and JRF’s focus is on Poverty, let’s explore what this might mean. Obviously the thing about poverty is that, well, it’s inherently intersectional. Understanding poverty in a place requires data from DWP (benefits and income), HMRC (tax credits and earnings), DLUHC (housing costs and deprivation), DfE (free school meals as a proxy), NHS (health inequalities), ONS (census and labour market), and local authorities (council tax support, local welfare). No single department owns the picture.
This intersectionality forces the system to work across boundaries from day one, which is where both the challenge and the potential value lies.
A phased approach
Rather than trying to build the full system immediately, a staged rollout builds value and trust progressively.
Phase 1: Internal discovery within a single department - Start within DWP. Help their analysts discover relevant datasets from other teams within their own department. This proves the enriched metadata and embedding approach, delivers immediate value, and requires no cross-departmental agreements. The key question to answer: does this help people find data they didn't know existed within their own organisation?
Phase 2: Cross-departmental metadata sharing - Extend to share enriched metadata, not the underlying data, across departments. Start with DWP and HMRC as the highest-value pairing for poverty analysis. This requires metadata sharing agreements, not data sharing agreements, which is a significantly lighter governance ask. Policy teams working on intersectional questions gain visibility into what evidence exists across government.
Phase 3: External access - Open the discovery and translation layer to researchers, local authorities, and VCSE organisations. This is where the feedback loop becomes most powerful, because a much wider and more diverse set of use-cases and questions flows back into the system.
Possibly the most interesting long-term implication is understanding and mapping the demand that emerges from the feedback loop. Over time, the system reveals patterns: "Lots of organisations in the North East are trying to answer questions about X, but no good administrative data source exists." Or: "This dataset is frequently matched to questions but users consistently report it isn't granular enough."
That's a powerful feedback signal to data producers. It makes the evidence-based case for what data should be published, at what granularity, with what frequency, and with what metadata. It closes the loop between data supply and data demand in a way that doesn't currently exist in the UK data landscape.
Beyond discovery: rethinking research access
Everything described so far concerns published data, the aggregates, tables, and statistics that government departments make available through their websites and platforms. But some of the most important administrative data never makes it into published outputs. Record-level benefits data, linked tax and earnings records, individual-level health and education data. This is the data that could answer the most pressing questions about poverty, but accessing it currently requires navigating one of the most restrictive research infrastructure models in the world.
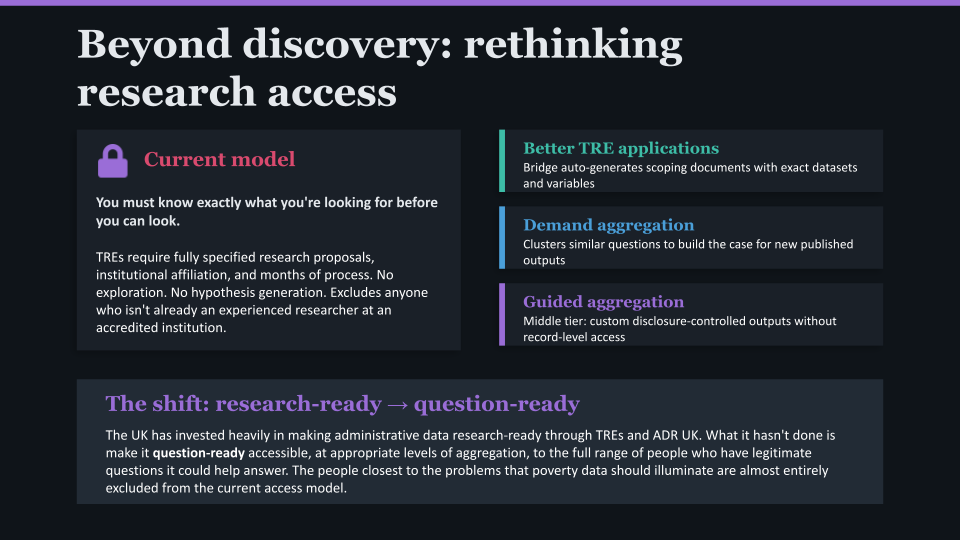
In the UK, detailed administrative data is primarily accessible through Trusted Research Environments - the ONS Secure Research Service, HMRC Datalab, DWP data sharing arrangements, and NHS Digital's Data Access Request Service. These often require a fully specified research proposal detailing your questions, methodology, required datasets and variables, and expected outputs. The process typically takes months. You need institutional affiliation and accreditation. The data never leaves the secure environment.
This model rests on a fundamental assumption: you must know exactly what you're looking for before you can look. You cannot just explore, poke at the edges. You cannot say "I think the relationship between housing benefit claims and GP registration patterns might reveal something about how people fall through gaps between services, but I need to see the data to know." You arrive with a finished question or you don't arrive at all.
The result is a system optimised for a narrow type of user, experienced quantitative researchers at accredited institutions who already know the data landscape well enough to name the specific datasets and variables they need. Everyone else is excluded: local authority analysts, VCSE organisations, policy teams working across departmental boundaries, and researchers at earlier stages of inquiry who haven't yet refined their hypotheses.
The Data Bridge concept has the potential to shift this in three ways.
Better-specified access requests Even within the existing TRE model, the bridge improves outcomes. A researcher who uses the translation layer to discover that a specific combination of DWP and HMRC variables would answer their question arrives at the application process with a stronger, more precisely scoped request. The bridge has done the preliminary investigation that currently requires either insider knowledge or months of desk research. This alone could significantly reduce the friction and failure rate of TRE applications.
Aggregated demand as evidence for new outputs - This is where it gets genuinely interesting. Currently, if fifty organisations across the country all want to understand the relationship between in-work poverty and housing costs in their area, each one separately discovers (or fails to discover) that the relevant data exists, separately works out that they'd need linked DWP and DLUHC data, and most give up because TRE access is beyond their reach. The bridge makes this demand pattern visible and quantifiable: "There were 200 queries this quarter attempting to understand in-work poverty and housing costs at local authority level. No published dataset serves this need. The underlying data requires record-level access through separate TRE applications to two departments."
This creates an evidence base for creating a new standard output, a pre-linked, appropriately aggregated, routinely published dataset designed to serve demonstrated demand without requiring individual record-level access. The feedback loop builds the business case for data producers to invest in new publications by showing them exactly what users need and how often.
A permissive middle tier: guided aggregation - The most ambitious implication is the possibility of a new access model sitting between open published tables and full TRE access. Call it guided aggregation. A user specifies their question through the bridge. The system identifies the relevant underlying datasets and variables. Rather than granting the user access to records, it runs pre-approved analytical queries against the data within the secure environment and returns aggregated, disclosure-controlled results tailored to the user's actual question.
The user never sees a record. The analysis is constrained to prevent re-identification. Statistical disclosure control is applied automatically. But the output is responsive to the specific question being asked, rather than being a one-size-fits-all published table that may not cut the data in the way the user needs.
This isn't unprecedented in concept. The Australian Bureau of Statistics' TableBuilder operates on a similar principle, users construct custom tabulations from microdata, with automated confidentialisation. But combining this with a semantic translation layer that helps users formulate their questions and identify the right data sources would be a significant step beyond what currently exists.
From research-ready to question-ready - The UK has invested substantially in making administrative data research-ready through TREs, the ADR UK programme, and the growing network of secure research infrastructure. This investment has been valuable. But research-ready is not the same as question-ready. Research-ready means the data is clean, documented, and available in a secure environment for accredited researchers with pre-approved proposals. Question-ready means the data is accessible at appropriate levels of aggregation and disclosure control to the full range of people who have legitimate questions it could help answer.
The shift matters because the people closest to the problems that poverty data should illuminate, frontline charities, community organisations, local authority officers, the people being described by the data are almost entirely excluded from the current access model. They have questions. The data has answers. The bridge isn't just about connecting the two but about building an infrastructure that treats their questions as legitimate grounds for access, not just the questions that arrive wrapped in a formal research proposal from a Russell Group university.
What this isn't
It's worth being clear about boundaries. This doesn't replace TREs or the safeguards they provide, record-level data access for complex research will always need secure environments and governance. It doesn't remove the need for analytical skills, statistical literacy, or human judgement about data quality. And the guided aggregation concept would need significant work on automated disclosure control and governance frameworks before it could operate at scale.
What it does is challenge the assumption that the only legitimate interaction with administrative data is a fully pre-specified research project. It suggests that discovery, exploration, and question-driven analysis are valid modes of engagement with public data, and that building infrastructure to support them would unlock value that the current model leaves on the table.
More practically, it takes the knowledge that currently lives in the heads of a small number of specialist intermediaries, the people who know what data exists, where to find it, what it can and can't tell you, and how different sources relate and makes that knowledge systematically accessible. And it takes the questions that thousands of organisations ask in isolation and makes them collectively visible, creating the demand signal that data producers need to justify investment in better, more accessible outputs.
It's also likely that this isn't the solution, or it's simply unworkable. What I heard in the workshop was people who think about this a lot more than me, with a lot more knowledge than me. And so, who really am I to think I've got the answer? Just someone who thinks questions are important, and that the biggest barrier to data isn't really data at all.