Building Soundings: a question-shaped layer over UK open data
Another blog on the ins and outs of something I've built, what it's all about, and why it might be a useful tool and/or concept. This time: Soundings an MCP server that wraps UK open data behind question-shaped tools.

This is another in a series of blogs exploring things I've built, lifting the lid on both the technical and conceptual ideas behind them. If you've read Building Open Recommendations or Building llms.txt for the social sector, you'll know the approach by now: practical, maybe a bit technical, but hopefully no hype.
It pulls together a few ideas and concepts I worked on in different ways. I've written before about why the biggest barrier to data isn't really data at all but that the gap is in the connection between data and need, not in the data itself. And I've written about why starting with questions changes everything. Rather than just write about them, I thought "show the thing" and so Soundings is what happens when you combine the two and smush some of the desire for better data about places together.
What is Soundings?
A "sounding" is the old nautical practice of dropping a weighted line over the side of a ship to measure the depth of the water. You can't see the bottom, so you take a measurement. That's the idea: taking the measure of local need.
In practical terms, Soundings is two things:
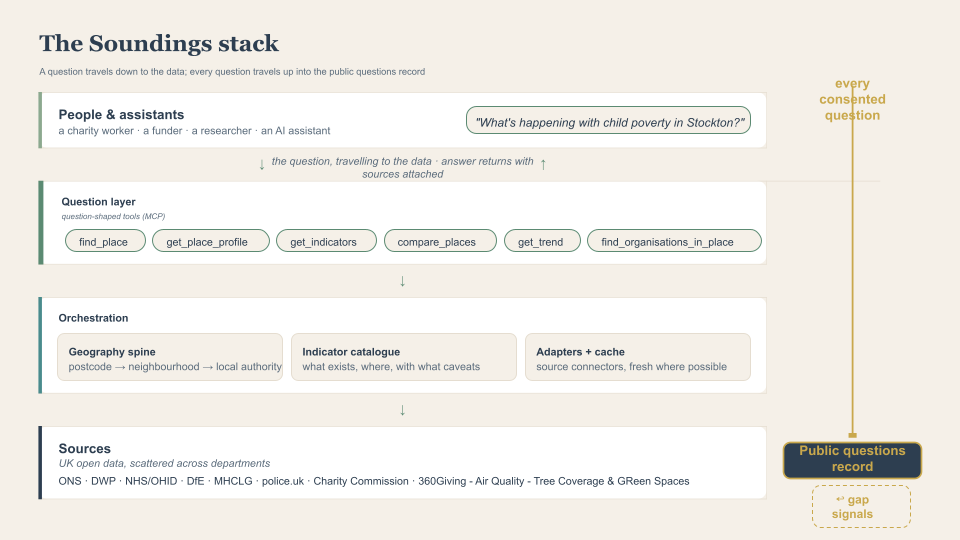
- An orchestration layer. A single server that wraps a curated set of UK open data sources: ONS Census, the Index of Multiple Deprivation, DWP benefits data, NHS health indicators, DfE education data, police.uk crime data, the Charity Commission register, 360Giving grants data, and more, behind a small set of question-shaped tools. You ask about a place; it works out which government department holds which dataset, fetches the numbers, and hands them back with full source citations.
- A capture layer. Every question asked, with consent, becomes a structured record in a public corpus. Not only for transparency, but because I think the questions themselves are the most valuable dataset the sector doesn't have. More on that later.
If someone at a charity asks "what's happening with child poverty in Stockton?", the answer exists. It's just spread across four government departments, three different websites, two APIs that need registration keys, and a set of geography codes that only make sense if you already know what an LSOA is. Soundings' job is to make that one question, with one answer*, with sources identified to check** and maybe go deeper
What is MCP?
Soundings is built as an MCP server (Model Context Protocol is an open standard for connecting AI systems to external tools and data) The easiest way to think about it is as a connector; any AI assistant that speaks MCP can plug into any MCP server and use its tools, without anyone building a bespoke integration.
This matters because it means Soundings isn't an app you have to visit. It's infrastructure other things plug into. You can use it from the Soundings website, yes but you could also add it to Claude and ask questions about places in the middle of whatever else you're doing. A funder's AI assistant could call it while assessing a bid. The interface layer is just an add on to this.
Question-shaped tools
Most data services expose datasets: "here is table QS103EW, good luck." Soundings exposes questions. The core tools are:
find_place— "where is this?" Turns "Stockton", or a postcode, into a canonical place.get_place_profile— "what's this place like?" A baseline across population, deprivation, economy, health, education, housing, crime.get_indicators— "what's the number for X here?"compare_places— "how does it compare?" With percentiles against similar places, because a raw number without context is mostly noise.get_trend— "is it getting better or worse?" Time series, including honest notes about breaks in the data where methodology changed.find_organisations_in_place— "who's working on this here?" Charities, their classifications, and the grants flowing in.
That's the question-centred approach made concrete. The tool surface is a set of questions, and behind each one the server does the unglamorous work of knowing that child poverty lives with DWP, school attainment with DfE, and life expectancy with the Office for Health Improvement and Disparities. The user's framing goes in; the departmental alphabet soup stays hidden, which is pretty much the "semantic translation layer" I sketched in the data gap post, except pointed at answering the question rather than just finding the dataset. Side note, I kind of thought the National Data Library might do something like this, but it just seems umm, like a new website?
How it actually works
The geography bit
Everything spatial in the UK hangs off a system of statistical geographies: LSOAs (Lower Super Output Areas, neighbourhoods of around 1,500 people), local authorities, wards, constituencies, regions. Every place in Soundings normalises to one of these, and a geography service handles the lookups: postcode to neighbourhood, neighbourhood to local authority, and the history of boundary changes (councils merge and split more often than you'd think).
There are some rules here: if the geography lookup fails, the whole request fails. I've tried to make sure Soundings doesn't just fully guess which place you meant.
The catalogue
Sitting across the adapters is a versioned catalogue of indicators which is a machine-readable file that says, for every measure, what it is, what unit it's in, whether higher is better or worse, which source it comes from, what geographies it's available at, and what the caveats are ("not directly comparable across UK nations", that sort of thing). This is like a very detailed metadata layer. It also enforces another geographic rule: if an indicator only exists at local authority level and you ask for it at neighbourhood level, you get an explicit "not available at this level" error. The server refuses rather than silently approximating.
The ask interface (the AI chat bit)
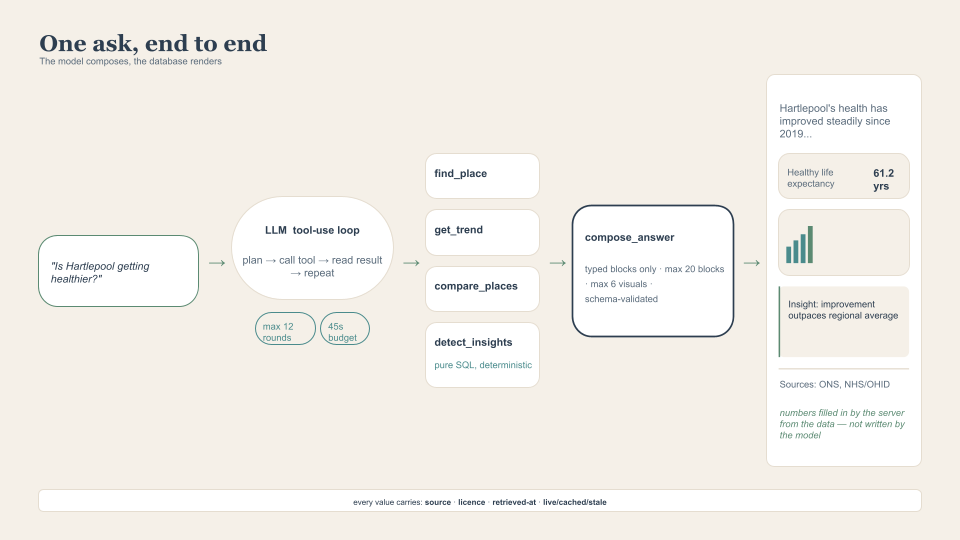
On top of the tools sits a natural-language interface: you type a question, and the LLM runs what's called a tool-use loop; it reads your question, decides which of the tools to call, looks at the results, maybe calls a few more, and then composes an answer. This is the same pattern as the RAG approach I described in the Open Recommendations post (the AI can only draw on what it's been given).
It's quite easy to bung an LLM chat interface on some data, but it's hard to make that trustworthy, how the AI is harnessed is important.
Keeping the AI on a short lead
The most consistent thing about LLMs is that they're inconsistent. If you're going to put one between the public and official statistics, you need more than good intentions. Here's the approach I took:
The model templates; the database fills in the details : The LLM doesn't write the answer as free text. It has to finish by calling a tool called compose_answer, handing over a strictly-validated list of typed blocks: a text block, an indicator card, a trend chart, a comparison chart, an insight callout. The cards and charts don't contain numbers the model wrote, they contain references (this indicator, this place), and the server fills in the values straight from the data it fetched. The model chooses what to show; it doesn't get to freehand the figures.
Data is data: There's a tool called detect_insights that finds the statistically notable things about a place such as "is it in the bottom decile of similar places for something? Diverging sharply from the median? Has a trend just reversed?" This is pure SQL. No AI involved. The same place and the same data produce the same signals every single time. The LLM's job is to narrate over these signals.
It tells you what it doesn't know: Ask it about the weather, the news, or for an opinion, and the system prompt instructs it to say, in one short block, that Soundings can't help with that, no tool calls, no improvising.
Citations citations citations: Every value that flows through the system carries a source reference: publisher, dataset, licence, when it was retrieved, and that cache status from earlier. The sources footer on every answer is assembled by the server from what was actually fetched.
The pattern underneath all of this: use the AI for what it's uniquely good at (understanding the question, choosing the tools, explaining the results in plain language) and use boring deterministic code for everything where being wrong has a cost. Schema validation, controlled vocabularies, strict structures.
An open set of questions as a public asset
Right now, thousands of people & organisations are potentially asking the same questions about their places, separately, invisibly, and the knowledge of what people actually need to know exists nowhere. A public record of questions makes demand visible. Which questions come up everywhere? Which ones couldn't be answered because the data doesn't exist at the right level, or at all? The system logs those misses too; every answer includes the questions it couldn't answer and maybe over time that becomes an evidence base for data publishers: here is what people are trying to find out, and here is exactly where you're failing them.
Limitations
- Coverage is England-heavy. Many sources are England-only or England-first, so Scotland, Wales and Northern Ireland are unevenly covered. I only have so much time for things I don't get paid for.
- The devil is in the detail: when I first shared this someone was very interested in the "who funds x in a place?" question. Currently this is answered by 360giving data, which is incomplete. To really answer the question you have two routes:
- Get every funder to publish on 360giving - this is the simplest and best approach
- Pull every charity in a place annual returns from charity commission, parse every pdf, turn this into structured data, query this. Possible. A pain in the arse...
- We can't answer every question. Some things people ask don't map onto any tool. But that's kind of the point we're trying to highlight here.
Final thoughts
The AI part is just a thin slice on top of boring infrastructure: In Open Recommendations I reckoned the AI was about 20% of the system. Here it's probably less. The geography spine, the adapters, the caching, the sanitisation pipeline - most of it is just standard data and deployment.
Get your harness right: Give the model a narrow, well-shaped channel and it's genuinely excellent, don't and you're asking for trouble.
Questions are infrastructure: stop me if you've heard this before.
It's a protoype: I built this all in bits of spare time and so there are still bugs, gaps and limits to what it can do. It's meant as a rough and ready demonstration of what can be done. It is not perfect by any stretch. It might not even be the right approach. But it's AN approach. Show the thing. Maybe you can do better, or you want to help me do better.
*one answer is relative - it returns the same data sources and data, but how this is returned and explained is model dependent
** check, always check
Edit - I should probably actually point to it! https://data.good-ship.co.uk/